Xdash AI is a comprehensive tool that utilizes advanced algorithms to streamline data analysis and improve decision-making processes. With its intuitive interface, users can easily generate insightful reports, visualize data trends, and extract valuable insights from complex datasets. The platform is designed to automate repetitive tasks, thereby saving time and increasing productivity. Xdash AI's advanced algorithms enable users to process and analyze data efficiently, making it easier to identify trends and make informed decisions.
The tool is particularly useful for business analysts, data scientists, decision-makers, and automation specialists who need to handle large volumes of data and derive actionable insights. By automating data processing and analysis tasks, Xdash AI allows users to focus on interpreting insights and driving strategic decision-making processes. The tool's visualization capabilities make it easy for stakeholders to understand complex data at a glance, enhancing the overall data-driven strategy of businesses.
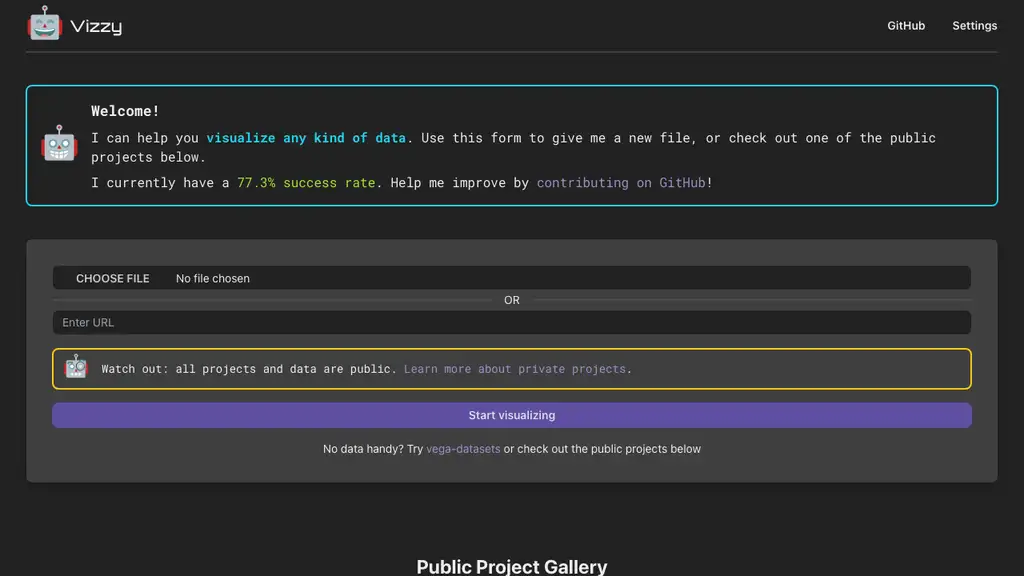
Vizzy is a powerful and user-friendly tool designed for rapid data visualization. By leveraging the capabilities of OpenAI's API, Vizzy allows users to generate API tokens quickly and store them securely, eliminating the need to manage API keys directly. The tool boasts a success rate of 77.3% and o...
Connecting to OpenAI's API for generating API tokens
Seamless data visualization without managing API keys directly
User-friendly interface
Success rate of 77.3%
Range of public projects for exploration
Data visualizationAPI connected dataDataset analysisOpen sourceArtificial Intelligence
Onvo AI is a powerful tool designed to simplify the creation of embedded data visualization dashboards and insightful reports. By leveraging simple AI prompts, users can generate beautiful and informative charts and visualizations without the need for complex queries or manual data manipulation. Onv...
Embedded data visualization dashboards
AI prompts for creating charts and visualizations
Customizable styling
Integration of data sources
User management with role-based access controls
AI data visualizationdata analyticsbusiness intelligencereport builderdashboard creation
Simple Analytics AI is an innovative tool designed to revolutionize the way users interact with their analytics. By enabling users to chat directly with their analytics, it eliminates the need for manual searches and cumbersome dashboard tools. This user-friendly platform provides real-time insights...
Real-time insights generation
Data analysis via analytics questions
Charts and data visualizations
User-friendly interface
Demo for hands-on experience
AI analyticsprivacydeveloper toolssmart data analysis
The tool ensures secure database connections through encryption, safeguarding user data. Whether users are connecting databases or writing queries directly within the tool, Magic Dash AI streamlines the analytics process, making it ideal for those aiming to derive valuable insights efficiently. The ...
Natural language interactions
Connect databases like Airtable and MongoDB
Visualize insights within seconds
Simplify data analysis process
Secure database connections
AI-powered analyticsnatural language insightsdatabase connectivitydata visualizationdeveloper tools
Datayaki is an AI-powered data analysis tool that allows you to easily analyze data in multiple formats, including Excel spreadsheets, desktop SQL databases, and cloud-based data sources. With Datayaki, you can simply ask questions using plain English and find insights without writing complex SQL qu...
Analyze data in multiple formats
Ask questions in plain English
Explainable AI for trust
End-to-end encrypted collaboration
Connect to popular databases
data analysis toolAI-powered analysisExcel data analysissecure collaborationexplainable AI
Transform data into interactive dashboards in minutes.
Breadcrumb.ai is a powerful tool designed to turn raw data into interactive dashboards, reports, and presentations within minutes. It empowers users to interact with and utilize data effectively, making it an essential tool for anyone looking to make data-driven decisions. With Breadcrumb.ai, you ca...
Customized dashboards creation
Intuitive drag-and-drop exploration of insights
AI-assisted data presentations generation
Seamless integration with 418 pre-built connectors
Real-time data filtering and smart recommendations
data visualizationdashboard generatorreport automationdata analysisbusiness insights
Low Code Data Analytics Platform - Helps businesses deliver data 5-10x faster with their existing team, giving them the agility and flexibility they need to be productive with deep data analysis....
Data analysis
Faster delivery
Existing team
Agility
Flexibility
Data Analytics AcceleratorAgile Data Delivery ToolFlexible Data Analysis Platform
Dashboards by Basedash is an innovative AI-powered admin panel generator designed to streamline the creation of internal tools. Unlike traditional internal tool builders that require extensive coding, dragging and dropping, or SQL knowledge, Basedash adapts to your data model and automatically gener...
Generates interfaces for databases in minutes
Visualize, edit, and explore data through dashboards and charts
Dashi is a powerful AI-enabled platform designed to help businesses construct internal tools quickly and efficiently. With Dashi, businesses can create custom internal applications in just a matter of minutes, mirroring the simplicity of crafting a typical word document. This tool is particularly be...
Transitioning spreadsheets into personalized business applications
Aiding small-medium businesses in building tailor-made solutions
Diagram.chat is an AI-powered tool designed to simplify the creation of diagrams and visualizations for data analysis and case study presentations. The tool's intuitive dashboard allows users to navigate seamlessly and utilize AI-generated insights to understand complex information through diagrams ...
AI-powered data analysis
Case study visualization
Diagram and chart generation
Customizable themes and colors
User-friendly interface
AI data visualizationDiagram generatorCase study visualizationDesign toolsProductivity
AI-powered data visualization and insights in 30 seconds.
ChartPixel is an AI-driven data analysis and visualization platform designed to transform raw data into actionable insights and interactive charts within 30 seconds. The platform excels in delivering written insights for each chart, backed by statistical data, real patterns, and trends. It offers a ...
Auto-generate charts and insights
Clean messy data
Engineer interesting new features
AI-assisted annotations and statistics
Keyword search tool
data analysischart generationAI visualizationdata cleaningsurvey analysis
Ask your SQL database anything, bonus Product Hunt demo
Veezoo Embedded Analytics is an AI-powered data analytics solution designed to provide both non-technical and technical users with seamless access to insights from their data. The tool allows non-technical users to ask questions in plain English and receive instant insights, while technical users ca...
Ask questions in plain English
Semantic, SQL-based modeling language
One-click dashboards
Robust data governance
Suggests follow-up questions
Data AnalyticsEmbedded AnalyticsSQL QueriesAI-poweredInsights
Hogwarts AI is an advanced tool for dashboard creation by using AI to transform plain text into insightful visual representations. With thousands of trained query patterns, this tool creates intuitive charts and summaries from diverse data sources such as PostgreSQL, Snowflake, Salesforce, and even ...
Transform plain text into visual representations
Query patterns trained on diverse data sources
Create visually compelling charts without SQL knowledge
Generate shareable charts for product documents and executive reviews
Intelligent chart recommendations for dashboard building
AI data visualizationtext-to-chart generatorinsightful dashboard creator
Supadash is an innovative AI tool designed to revolutionize the way you visualize and analyze your database data. With Supadash, you can connect your database and instantly generate AI-driven charts and visualizations without any coding knowledge. This tool is perfect for those who want to streamlin...
Instant visualization of database data
AI-generated charts for data analytics
Automatic generation of time series charts
Transformation of raw data into insightful dashboards
Enhanced productivity in data analysis process
AI data visualizationdatabase visualizationautomated analyticsdata dashboardstime series charts
Parse.dev is an AI-powered data analyst tool designed to revolutionize the way you access and analyze data. With Parse.dev, you can say goodbye to complex SQL queries and welcome an intuitive and seamless experience. This tool allows you to effortlessly query databases without the need to write intr...
AI-powered data analysis
Intuitive data querying
Database access and analysis
No need for complex SQL queries
Efficient insights generation
AI data analystautomated data analyticsintuitive data querybusiness intelligencedata visualization
Transform questions and data into insightful visuals.
MyLens.AI simplifies learning by transforming questions and complex data into clear, easy-to-understand visuals. With just one click, users can generate visuals that highlight key insights and provide deep understanding. Whether you're asking a question or uploading intricate data, MyLens.AI creates...
Generate visuals with one click
Convert complex data into clear visuals
Supports timelines, mind maps, quadrants
Easy-to-understand visual representations
Highlights key insights for deep understanding
Data VisualizationLearningVisual InsightsEducationProductivity
AI-powered visual data management and collaboration.
EZQL, powered by Outerbase, is an innovative AI-driven tool designed to revolutionize the way users interact with and manage visual data. This tool eliminates the need for a database expert by enabling users to query, edit, and organize data without writing a single line of SQL. EZQL offers a seamle...
View, update, and collaborate on visual data
Query, edit, and organize data without SQL
Generate stunning dashboards and customize charts
Embed data and charts wherever needed
Connect to popular databases
Visual data managementCollaborative data toolAI-poweredData organizationDashboard generation
Additionally, Latitude serves as an open-source framework for embedded analytics, allowing users to create API endpoints on top of their databases or warehouses using just SQL. These endpoints can then be used to embed interactive visualizations natively within their preferred frontend frameworks or...
Transform raw data into actionable insights effortlessly.
DataSquirrel is a comprehensive Business Intelligence (BI) platform designed to simplify data analysis and visualization for individuals and teams without requiring technical skills. This tool allows users to upload data files in various formats such as CSV, Excel, and Google Sheets. Once the data i...
Automatic data cleaning and augmentation
Generates insightful visualizations and dashboards
The tool also offers robust visualization features, allowing users to create charts and graphs that make the data more comprehensible and actionable. Additionally, ChatCSV enables users to rename, delete, and share conversations, making it a collaborative tool that can be used across various teams a...
Import CSV files from multiple sources
Generate common questions for quick analysis
Visualize data with charts and graphs
Rename, delete, and share conversations
Analyze trends in various industries
data analysisCSV analyzerdata visualizationbusiness intelligencedata insights
Additionally, KnowledgeVIC, powered by humanli.ai, revolutionizes document interaction by delivering seamless access, analysis, and insights. This AI tool allows users to distill valuable insights from complex research papers, compare documents for a profound understanding, and effortlessly access a...
Seamless integration of generative AI throughout enterprises
Management of diverse data sources
Expedited responsible AI workflows
Efficient extraction and analysis of relevant data
Visualization of complex datasets
AI data integrationAI analyticsdata visualizationproductivityconsulting
Chartify is an innovative AI-powered data visualization tool designed to simplify the process of generating beautiful and insightful charts from uploaded data. Users can upload data in CSV format and receive recommended visualizations, eliminating the need for manual chart editing or coding. Leverag...
Ask data questions in plain English, get automated insights
The Channel AI tool allows users to ask data questions in plain English and receive automated answers from connected databases. It is designed to provide self-service data insights without requiring SQL knowledge. The tool also offers automated visualizations based on data preferences and allows for...
Ask data questions in plain english
Receive automated answers from connected databases
Provide self-service data insights without requiring sql knowledge
Offer automated visualizations based on data preferences
Collaborate among teams to best understand and utilize data
Channel AIself-service data insightsautomated visualizations
Grapha AI is a cutting-edge tool designed to revolutionize the way you interact with and understand your data. By leveraging advanced AI-assisted data exploration, Grapha AI enables users to uncover hidden trends and patterns within minutes, rather than hours. This powerful tool allows you to transf...
AI-assisted data exploration
Revealing hidden trends and patterns in minutes
Analyzing over 7.5k datasets
AI-assisted storytelling for informed decisions
Exporting clean aggregated data effortlessly
Data explorationData analysisData visualizationAI insightsBusiness intelligence