Business Intelligence
Freemium
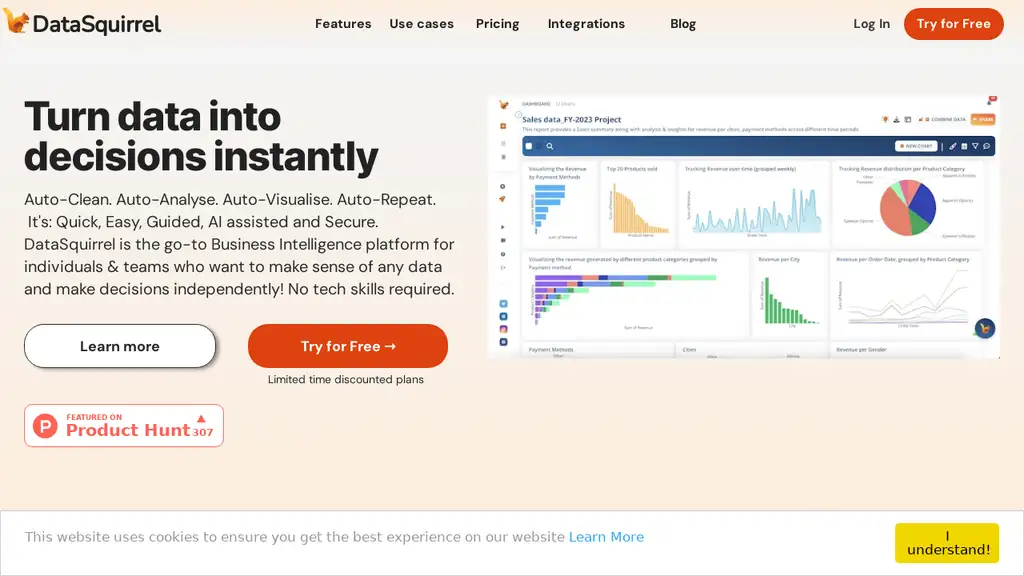
DataSquirrel is a comprehensive Business Intelligence (BI) platform designed to simplify data analysis and visualization for individuals and teams without requiring technical skills. This tool allows users to upload data files in various formats such as CSV, Excel, and Google Sheets. Once the data is uploaded, DataSquirrel employs AI to automatically clean inconsistencies, analyze the data, and generate insightful visualizations and dashboards. The platform supports auto-cleaning of data, which corrects issues like different date formats, empty rows, typos, and input errors, ensuring that the data is accurate and ready for analysis without the need for manual intervention or complex formulas. Additionally, it can augment data by converting currencies, recalculating units of measure, or adding external data such as weather or stock information, all without the need for formulas. Users can also customize their dashboards, share them with team members, and automate data refresh and report distribution. This enables quick and effective decision-making based on real-time data insights.
DataSquirrel also offers features like interactive visualizations, custom themes, and detailed segmentation and filtering options to ensure that the data is presented in the most meaningful way for different audiences. The platform's automated analysis capabilities, such as the 'Go Auto' feature, allow users to generate key graphs and insights with just a click, making it easier to comprehend and share data stories. DataSquirrel's collaboration features include the ability to leave comments on charts, download visualizations, and share interactive dashboards via email or messaging apps, facilitating seamless teamwork and communication. With DataSquirrel, users can transform raw data into actionable insights quickly and efficiently, making it an invaluable tool for business managers, data analysts, and business owners across various industries.
Not reviewed yet
Automatic data cleaning and augmentation
Generates insightful visualizations and dashboards
Customizable and shareable dashboards
Interactive visualizations and detailed filtering
Automated data refresh and report distribution
Users can effortlessly clean and analyze data without technical skills.
Teams can collaborate on data insights with interactive dashboards.
Business managers can make quick, data-driven decisions.
Data analysts can automate report generation and distribution.
No promo codes available
Not rated by users yet
For social proof, the following badge embedding HTML code can be copied onto the tool website's homepage or footer. Badges can validate the tool to potential customers.
Business OS in minutes
Transform data into interactive dashboards in minutes.
Streamline data analysis and decision-making.
Self-service BI with ChatGPT integration
AI-Powered Due Diligence for Businesses
The Power of Data Science for Business Decision Making