
Freemium
Create captivating visuals in seconds
Piktochart AI is an innovative tool designed to help users create captivating visuals effortlessly. This AI-powered infographic maker allows you to transform ideas into professionally designed infographics, posters, banners, and more with just a few clicks. The user-friendly drag-and-drop editor ens...
- AI-powered design tool
- User-friendly drag-and-drop editor
- Integration with various file formats
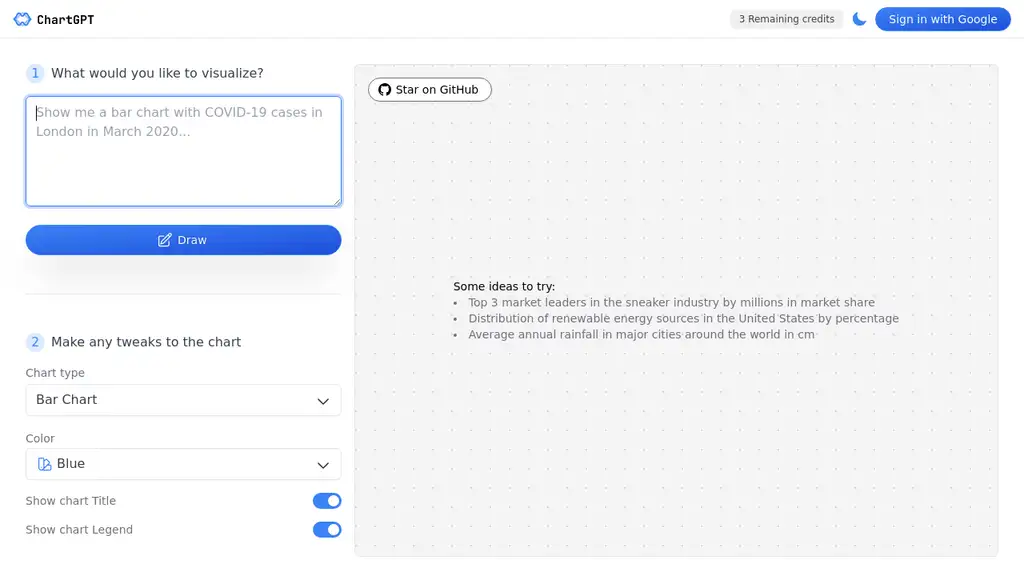
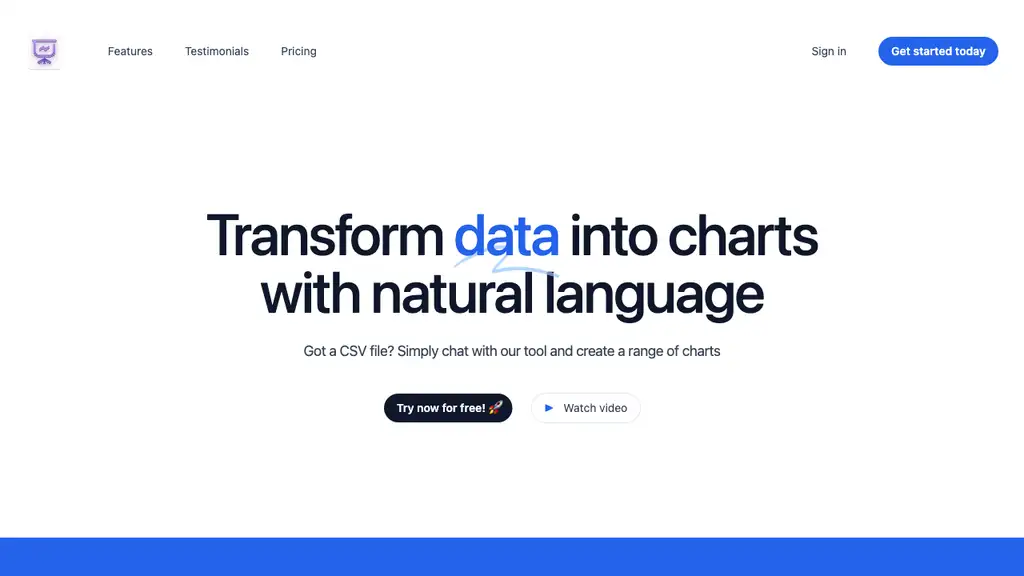
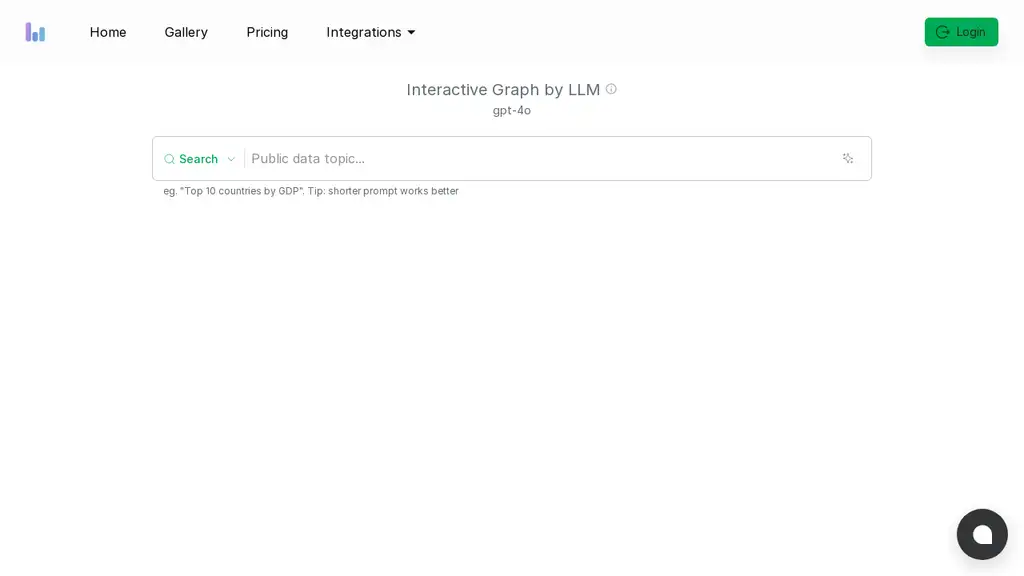
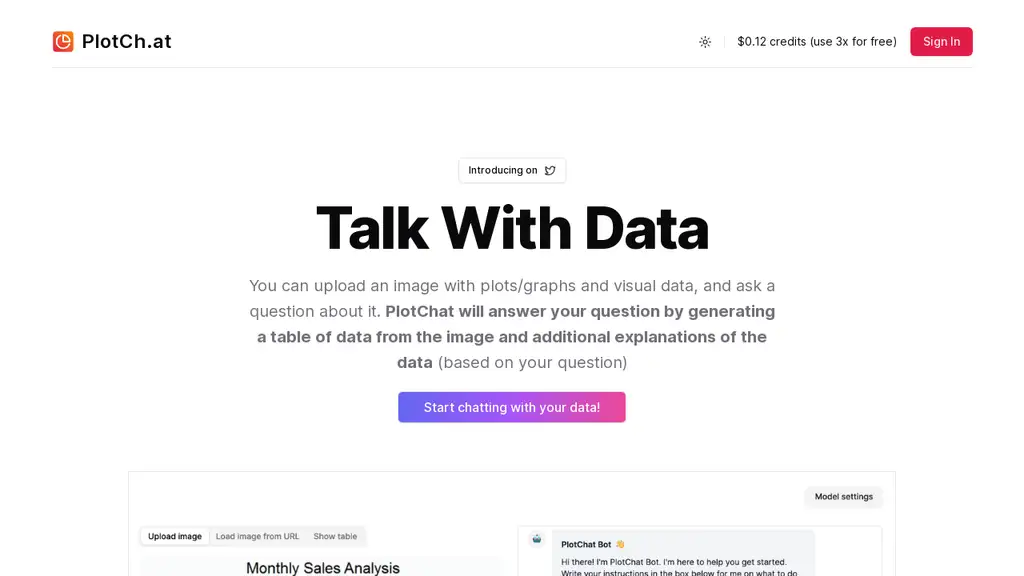
- Data visualization with charts and graphs
- Video editing functionality
infographic makervisual contentdata visualizationdesign toolvideo editing
Design