Data Visualization
Freemium
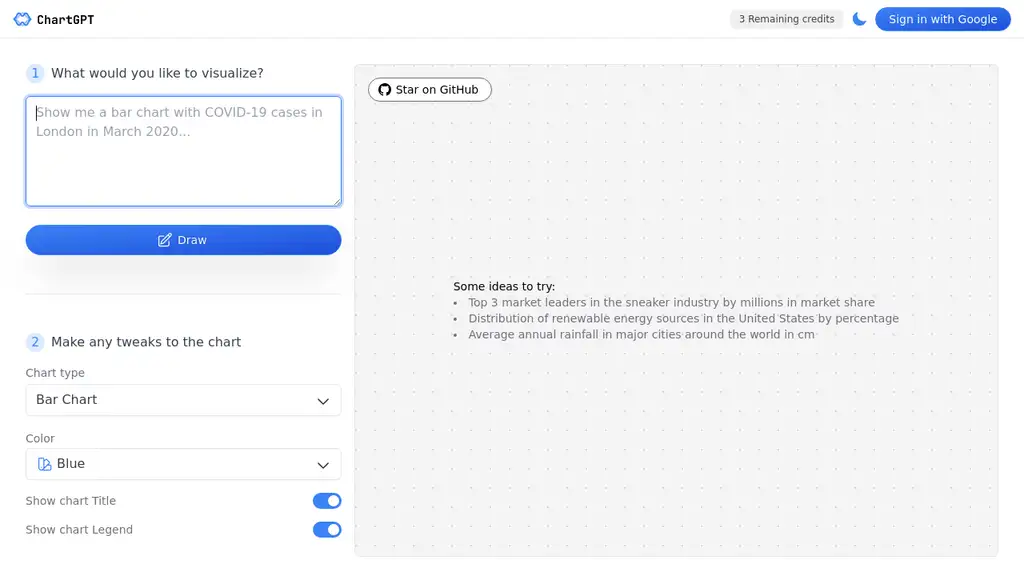
ChartGPT is an advanced AI tool designed to facilitate the creation, customization, and visualization of a wide array of chart types. Whether you need bar charts, area charts, line charts, pie charts, scatter charts, radar charts, radial bar charts, treemaps, or funnel charts, ChartGPT has you covered. The tool offers extensive customization options, allowing users to adjust colors, titles, and legends to suit their specific needs. This makes it an invaluable resource for anyone looking to present data in a clear, engaging, and visually appealing manner.
ChartGPT is particularly useful for displaying complex data sets such as market share distribution, renewable energy sources percentages, or average annual rainfall in major cities worldwide. Its flexibility and functionality make it an ideal choice for a variety of data visualization projects. Whether you're a data analyst, project manager, business intelligence professional, marketing professional, researcher, student, or teacher, ChartGPT provides the tools you need to create informative and visually compelling charts. The tool is available on multiple platforms, ensuring that you can access it whenever and wherever you need it. With ChartGPT, you can transform raw data into meaningful visualizations that effectively communicate your insights and findings.
Not reviewed yet
Create a variety of chart types
Customize chart appearance
Visualize data effectively
Adjust colors, titles, and legends
Flexible functionality for diverse data visualization needs
Easily create an informative bar chart showcasing market share distribution for a business presentation with ChartGPT's customizable features and user-friendly interface.
Visualize renewable energy sources percentages through a visually appealing pie chart using ChartGPT, making complex data easily understandable for stakeholders and clients.
Generate a detailed radar chart comparing average annual rainfall in major cities worldwide, allowing for a quick and comprehensive analysis of data trends with ChartGPT.
No promo codes available
Not rated by users yet
For social proof, the following badge embedding HTML code can be copied onto the tool website's homepage or footer. Badges can validate the tool to potential customers.
Analytics at the speed of thought.
Transform prompts into detailed infographics and charts.
Autogenerate charts from CSVs with AI
Quickly create various types of charts effortlessly.
AI-powered data visualization and insights in 30 seconds.
Manipulate and ask questions about your data. All with text.