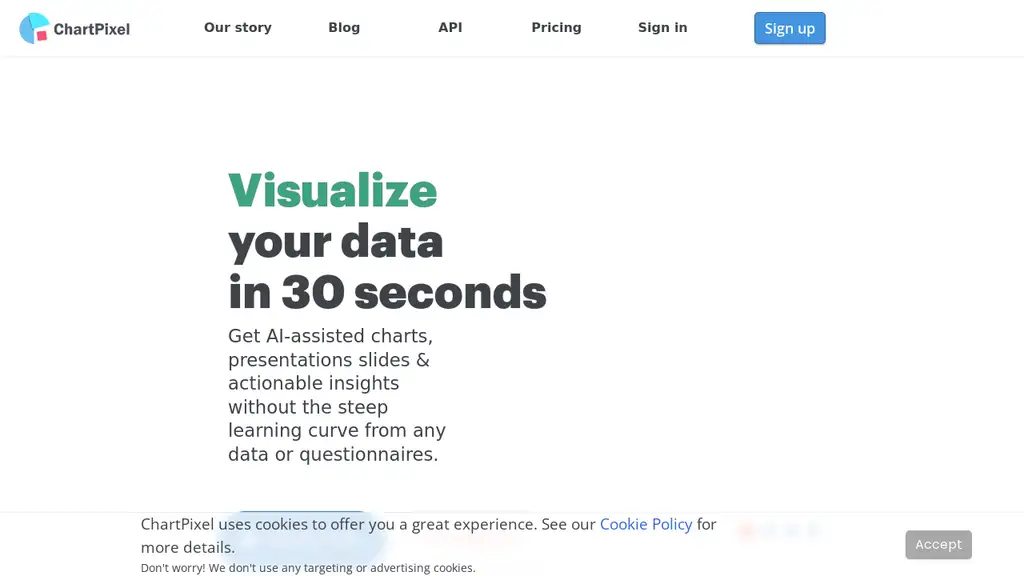
AI-powered data visualization and insights in 30 seconds.
ChartPixel is an AI-driven data analysis and visualization platform designed to transform raw data into actionable insights and interactive charts within 30 seconds. The platform excels in delivering written insights for each chart, backed by statistical data, real patterns, and trends. It offers a comprehensive suite of features that cater to both beginners and seasoned analytics professionals, making data analysis accessible and straightforward for everyone.
One of the standout features of ChartPixel is its ability to instantly visualize data. Users can upload spreadsheets in various formats, including Excel, CSV, and Google Sheets, and the platform will automatically clean the messy data, engineer new valuable features, and select relevant columns and chart types. The AI-powered insights provide explanatory annotations that make the data easy to understand.
ChartPixel supports over twenty different chart types, allowing users to choose the most suitable visualization for their data. The platform also offers a one-click share and export feature, enabling users to convert data insights into PowerPoint presentations that combine visual appeal with statistical accuracy. Upcoming features include dashboard publishing and exporting to Word and Excel, further enhancing the platform's versatility.
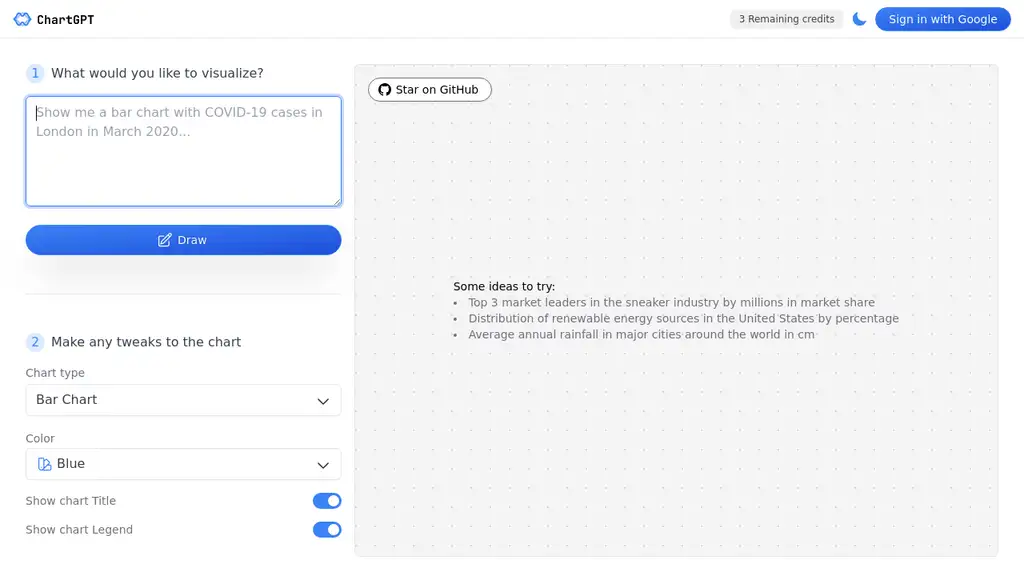
ChartGPT is an advanced AI tool designed to facilitate the creation, customization, and visualization of a wide array of chart types. Whether you need bar charts, area charts, line charts, pie charts, scatter charts, radar charts, radial bar charts, treemaps, or funnel charts, ChartGPT has you cover...
Create a variety of chart types
Customize chart appearance
Visualize data effectively
Adjust colors, titles, and legends
Flexible functionality for diverse data visualization needs
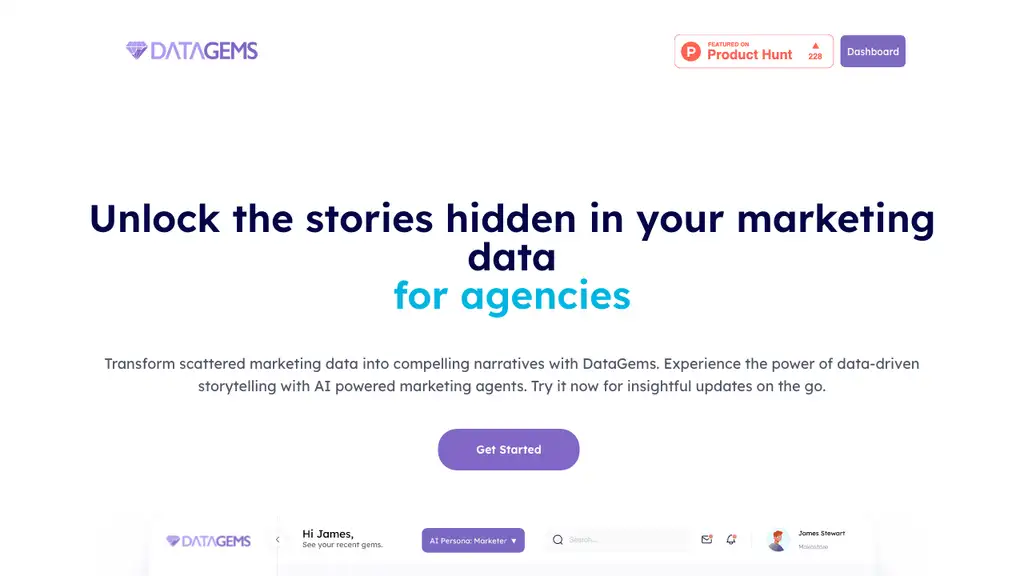
ChartGPT is an advanced AI-driven tool that revolutionizes the data experience by enabling users to discover insights through conversational analytics. With ChartGPT, users can choose datasets, chat with the tool, and visualize data insights like never before. It also offers access to a data marketp...
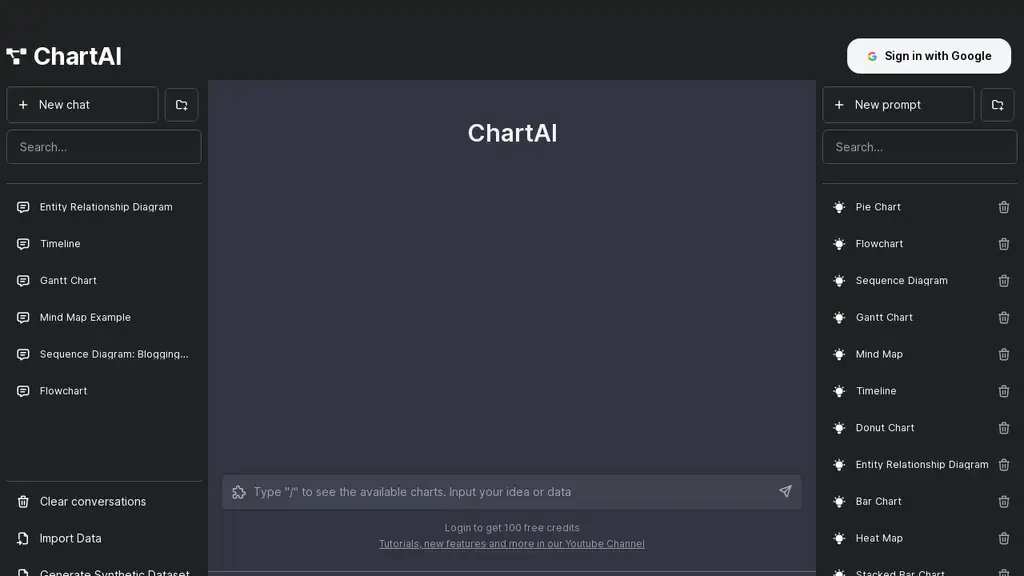
ChartAI is the first AI driven diagramming application that helps professionals quickly building diagrams with AI. Simply input your data and diagram requirements, and let chartAI's AI engine do the rest.
Within minutes, you'll have a professional-looking diagram that's ready to use....
Diagramming
Data input
Ai engine
Professional-looking diagram
Quickly build
AI diagramming toolautomated diagram buildersmart diagramming software
Chat2CSV is an innovative data visualization platform designed to transform your CSV data into various types of charts using natural language processing. This AI-powered tool allows users to interact with their data in a conversational manner, eliminating the need for complicated coding or scripting...
Natural language processing for chart creation
Diverse selection of chart types
Data security and privacy measures
Intuitive interface for easy use
Data VisualizationNatural LanguageCSVChartsData Security
AI-powered tool for data analysis, charts, and graphs.
Graphy.app is an AI-powered tool designed to revolutionize the way users approach data analysis, charts, and graphs. By leveraging advanced AI algorithms, Graphy.app provides users with AI-generated insights that help in analyzing trends and patterns within datasets. This tool is particularly benefi...
AI-generated insights for data
Customizable insights based on metrics
User-friendly data input interface
Advanced trend and pattern analysis
Accessible to non-technical users
Data analysisData visualizationAI insightsBusiness intelligenceCustomizable charts
Grapha AI is a cutting-edge tool designed to revolutionize the way you interact with and understand your data. By leveraging advanced AI-assisted data exploration, Grapha AI enables users to uncover hidden trends and patterns within minutes, rather than hours. This powerful tool allows you to transf...
AI-assisted data exploration
Revealing hidden trends and patterns in minutes
Analyzing over 7.5k datasets
AI-assisted storytelling for informed decisions
Exporting clean aggregated data effortlessly
Data explorationData analysisData visualizationAI insightsBusiness intelligence
Diagram.chat is an AI-powered tool designed to simplify the creation of diagrams and visualizations for data analysis and case study presentations. The tool's intuitive dashboard allows users to navigate seamlessly and utilize AI-generated insights to understand complex information through diagrams ...
AI-powered data analysis
Case study visualization
Diagram and chart generation
Customizable themes and colors
User-friendly interface
AI data visualizationDiagram generatorCase study visualizationDesign toolsProductivity
Piktochart AI is an innovative tool designed to help users create captivating visuals effortlessly. This AI-powered infographic maker allows you to transform ideas into professionally designed infographics, posters, banners, and more with just a few clicks. The user-friendly drag-and-drop editor ens...
GRID Smart Charts for Notion & Airtable is a revolutionary tool that transforms the way users interact with and present their data. Designed as a magical surface where numbers and narrative meet, GRID offers a built-in AI formula copilot, powerful integrations, and interactive features that help use...
PlotChat is an innovative AI tool designed to help users analyze and discuss data embedded in images. By leveraging advanced AI models such as GPT-4 Vision and Google's Deplot combined with LLM (Large Language Models), PlotChat allows users to upload images of plots and graphs and engage in meaningf...
Data-in-image comprehension
Answer generation from questions
Integration with Google's deep learning technology
Real-time chat functionality
Convenient data analysis tool
image data analysisvisual data interpretationAI-assisted data discussiondata comprehensioninteractive data chat
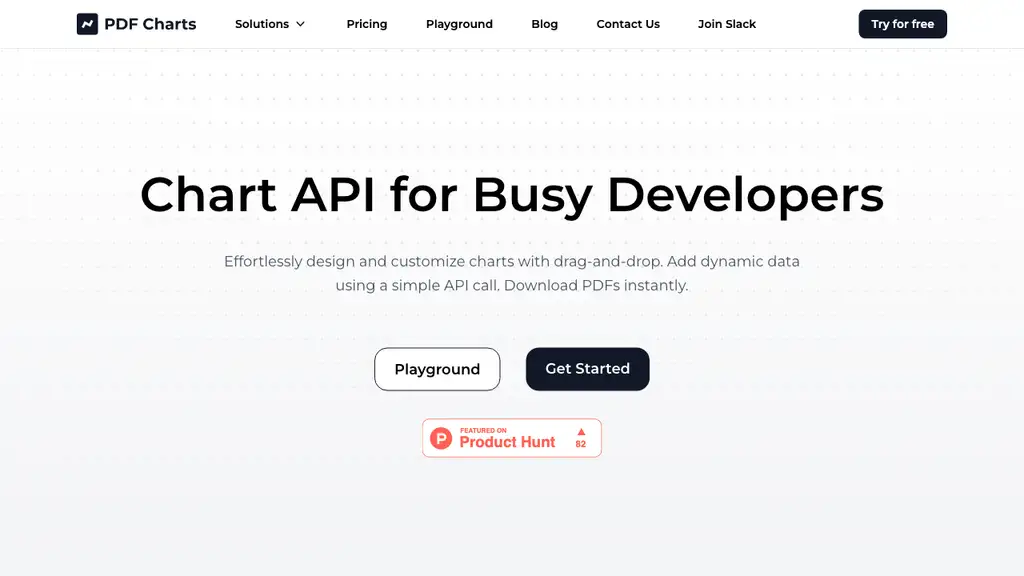
PDF Charts is a user-friendly tool specifically designed for busy developers who need to create and customize charts for PDF documents effortlessly. The tool features a simple drag-and-drop interface that makes designing charts a breeze. Additionally, it supports dynamic chart generation through API...
User-friendly drag-and-drop interface
Dynamic charts generated through API calls
Securely encrypted PDFs
AI assistant for prompting chart creation
Ability to generate up to 50 PDFs monthly
PDF chart generatorDeveloper toolsData visualizationAPI integrationSecure PDFs
Columns.ai is an innovative data storytelling AI tool designed to transform raw data into engaging and visually appealing stories. Leveraging the power of ChatGPT, an advanced language model, Columns.ai enables users to generate insightful responses to a wide range of data-related prompts and querie...
Create engaging data stories
Insights from prompts and queries
Customize graph settings
Create interactive visualizations
Collaborate within community
data storytellingdata visualizationdata analysisinteractive graphscollaboration
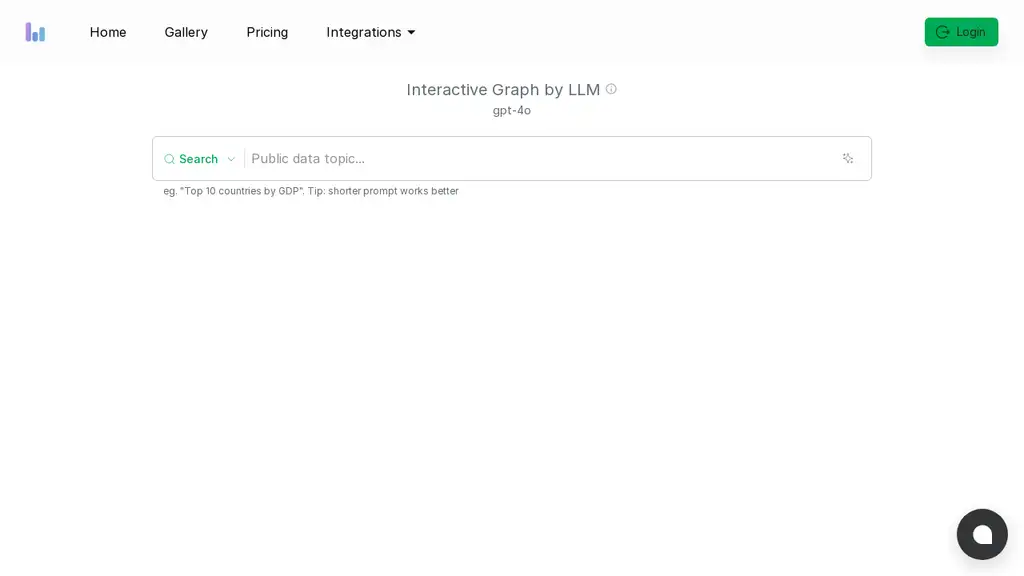
Quickly create various types of charts effortlessly.
Graph Generator is a user-friendly tool designed to quickly create various types of charts such as bar, line, area, and pie charts. With a simple input query, users can generate a preview graph based on their data. This tool simplifies the process of generating graphs by allowing users to input quer...
Quick creation of various types of charts like bar, line, area, and pie charts
Simple input query for generating preview graph based on data
Support for inputting queries in English inside curly brackets
Compatibility with JSON, XML, CSV, and raw data formats
Utilizes QuickChart for efficient data visualization
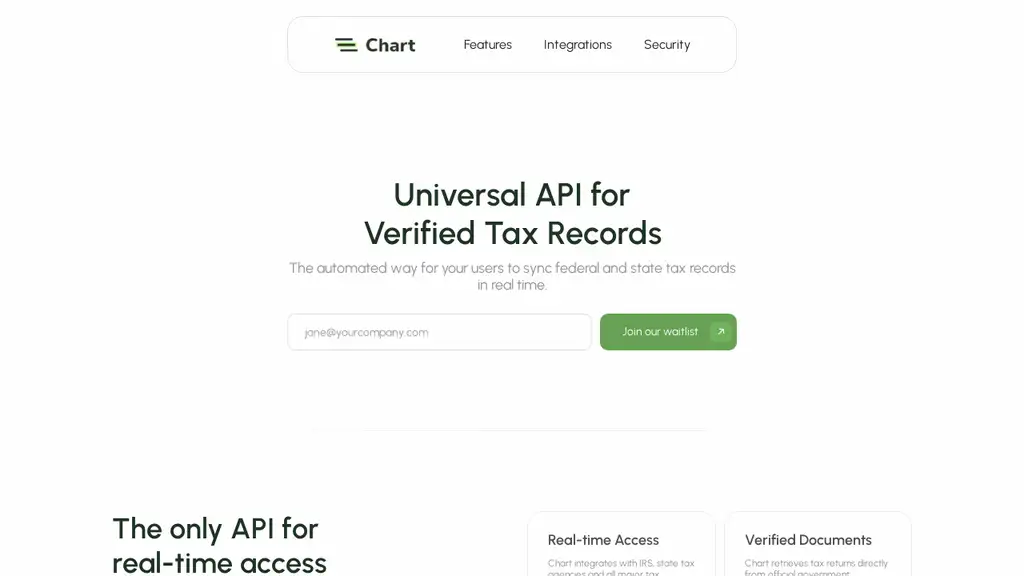
Automate tax document collection for tech companies.
Chart is an API solution designed for tech-oriented companies to automate the collection of tax documents from their customers. It integrates seamlessly with IRS, state tax agencies, and all major tax preparation software to provide real-time access to federal and state tax records. This ensures tha...
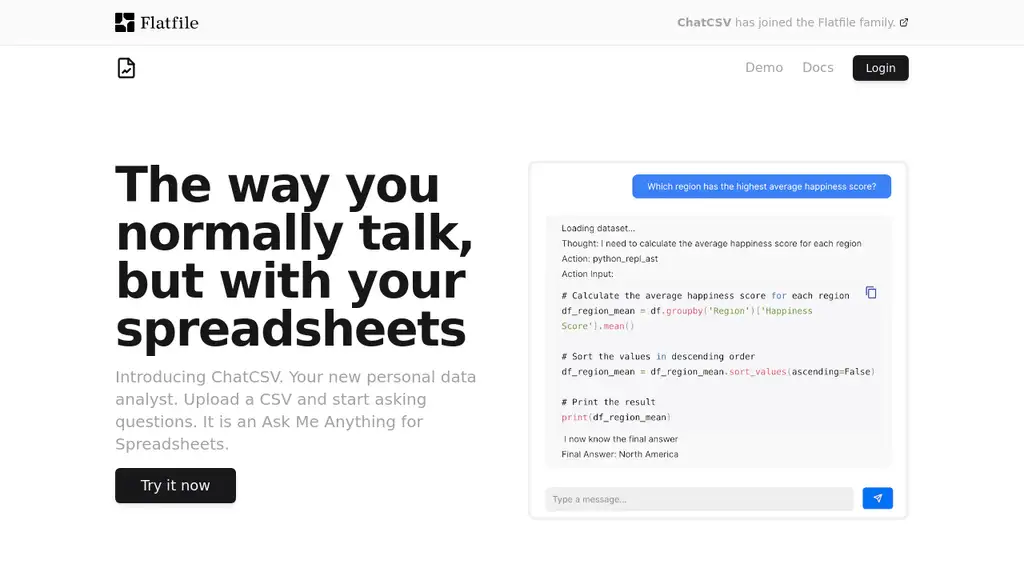
The tool also offers robust visualization features, allowing users to create charts and graphs that make the data more comprehensible and actionable. Additionally, ChatCSV enables users to rename, delete, and share conversations, making it a collaborative tool that can be used across various teams a...
Import CSV files from multiple sources
Generate common questions for quick analysis
Visualize data with charts and graphs
Rename, delete, and share conversations
Analyze trends in various industries
data analysisCSV analyzerdata visualizationbusiness intelligencedata insights
Hogwarts AI is an advanced tool for dashboard creation by using AI to transform plain text into insightful visual representations. With thousands of trained query patterns, this tool creates intuitive charts and summaries from diverse data sources such as PostgreSQL, Snowflake, Salesforce, and even ...
Transform plain text into visual representations
Query patterns trained on diverse data sources
Create visually compelling charts without SQL knowledge
Generate shareable charts for product documents and executive reviews
Intelligent chart recommendations for dashboard building
AI data visualizationtext-to-chart generatorinsightful dashboard creator
Ask data questions in plain English, get automated insights
The Channel AI tool allows users to ask data questions in plain English and receive automated answers from connected databases. It is designed to provide self-service data insights without requiring SQL knowledge. The tool also offers automated visualizations based on data preferences and allows for...
Ask data questions in plain english
Receive automated answers from connected databases
Provide self-service data insights without requiring sql knowledge
Offer automated visualizations based on data preferences
Collaborate among teams to best understand and utilize data
Channel AIself-service data insightsautomated visualizations
Shape is an advanced AI tool designed to enable users to explore and analyze their data efficiently. It functions as a virtual data analyst, providing quick and insightful answers to complex data questions within seconds. Shape supports various types of queries, including new subscriptions, average ...
Revolutionize content creation and presentation skills.
Skills.ai is an AI-powered analytics tool designed to revolutionize content creation and presentation skills. Ideal for businesses, academics, and creators, Skills.ai enables users to instantly generate reports and presentations without the need for coding. This tool allows for the creation of stand...
Instant report and presentation generation without coding
Creation of standout client meeting materials and social media content
Complex analysis and stunning visualizations
Advanced AI capabilities for uncovering crucial insights
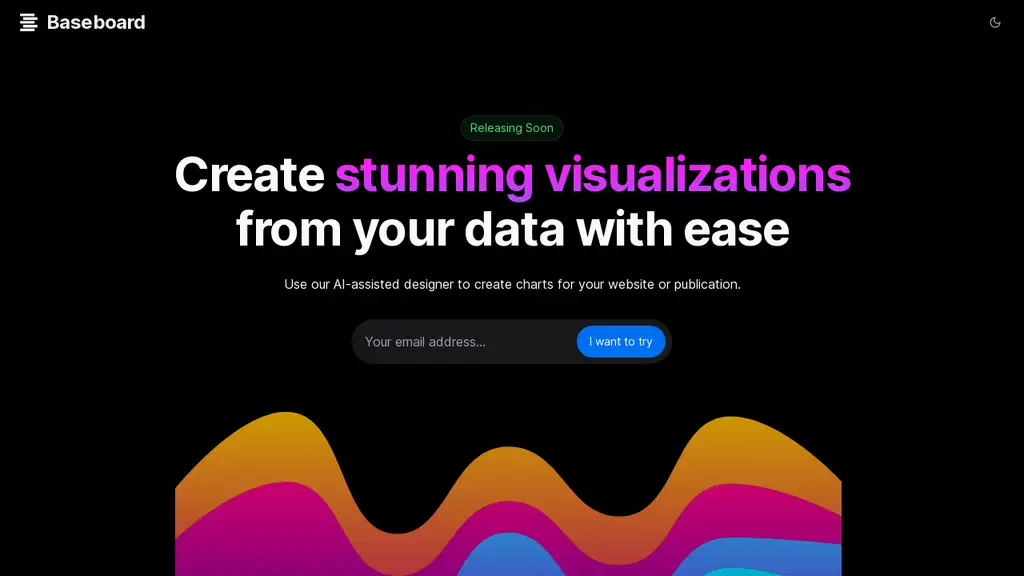
Baseboard is an AI-powered tool designed to help users quickly and efficiently obtain insights from their data. One of its standout features is the toggle theme option, which allows users to switch between different visual themes effortlessly, enhancing the visual appeal of their data presentations....
Obtain insights from data quickly
Toggle theme feature for visual appeal
Intuitive AI-assisted designer
Create stunning visualizations
Produce high-quality data visualizations
data visualizationAI insightstheme toggledata analysisAI designer
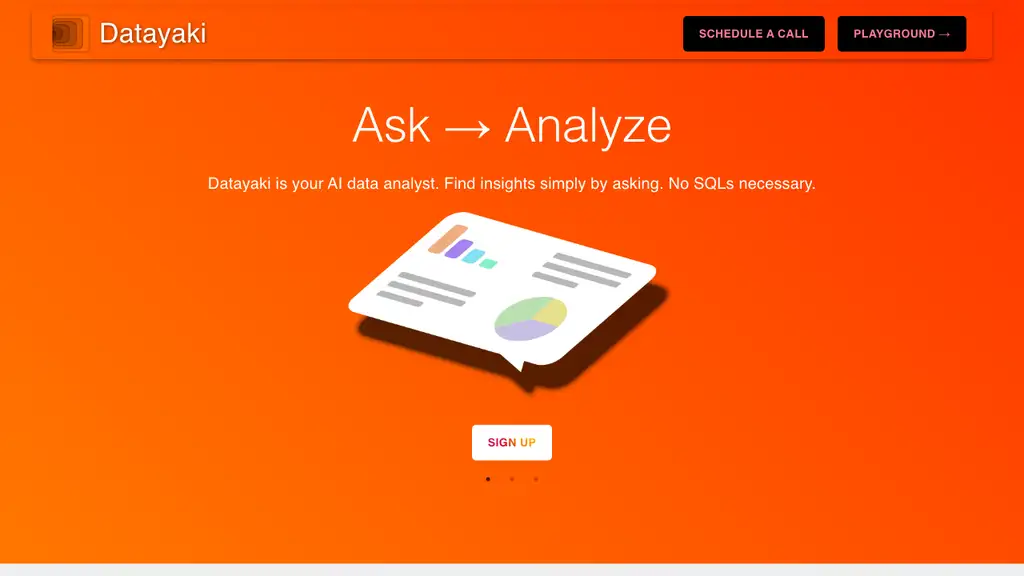
Datayaki is an AI-powered data analysis tool that allows you to easily analyze data in multiple formats, including Excel spreadsheets, desktop SQL databases, and cloud-based data sources. With Datayaki, you can simply ask questions using plain English and find insights without writing complex SQL qu...
Analyze data in multiple formats
Ask questions in plain English
Explainable AI for trust
End-to-end encrypted collaboration
Connect to popular databases
data analysis toolAI-powered analysisExcel data analysissecure collaborationexplainable AI
Tableau AI is an intelligent analytics tool designed to enhance decision-making and streamline tasks through advanced features such as Tableau Pulse and Einstein Copilot. This platform offers scalable analytics solutions that seamlessly integrate AI technologies, enabling users to explore the latest...
Tableau Pulse feature
Einstein Copilot feature
Scalable analytics solutions
Integration of AI technologies
Advanced data management capabilities
AI analyticsdata visualizationintelligent data analysis
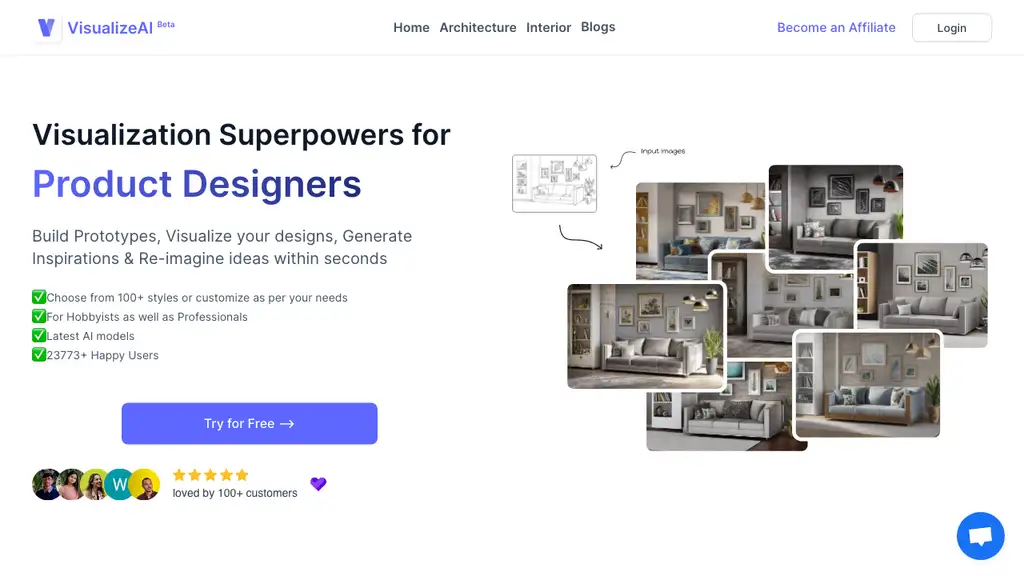
Visualize, Re-Imagine and bring your ideas to life using AI
VisualizeAI is an advanced AI-based tool designed to help users bring their creative ideas to life through prototyping, visual design, and generating inspiration within seconds. The tool leverages state-of-the-art AI models to allow users to upload input images or sketches and configure their desire...
Prototyping with AI
Advanced visual design capabilities
Generate design inspiration quickly
Over 100 customizable styles
User-friendly interface
AI prototypingvisual designstyle generatorinterior designproduct design
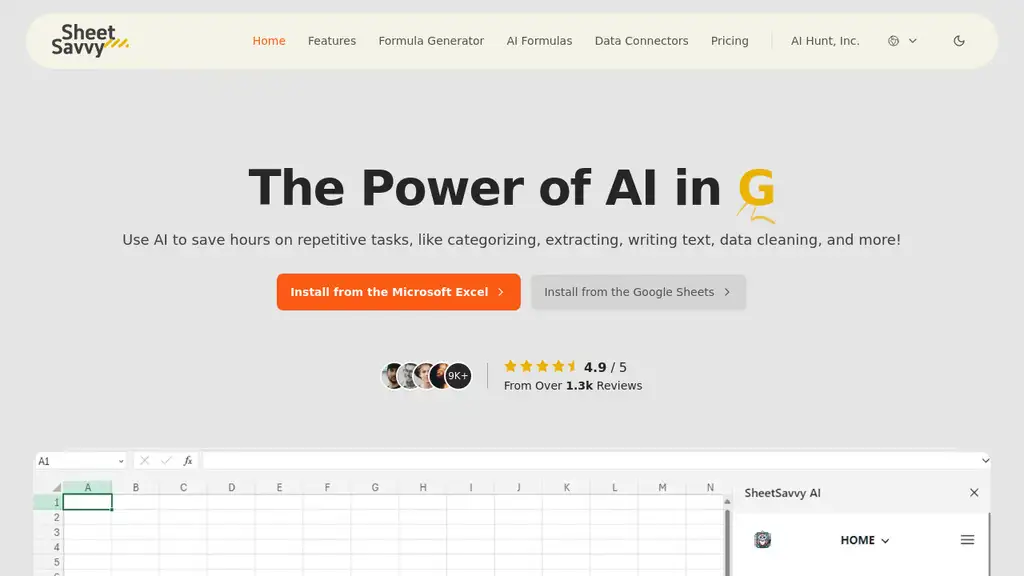
SheetSavvy AI is a revolutionary tool that integrates advanced AI technology directly into spreadsheets, transforming the way users handle tasks such as categorizing, extracting, writing text, and data cleaning. This powerful tool allows users to convert text prompts into complex formulas effortless...
Integrates AI technology into spreadsheets
Converts text prompts into complex formulas
Provides simplified explanations for intricate formulas
Generates scripts to automate workflow processes
Offers real-time data import from various tools without coding
AI spreadsheetdata manipulationautomated workflowproductivitydata analytics
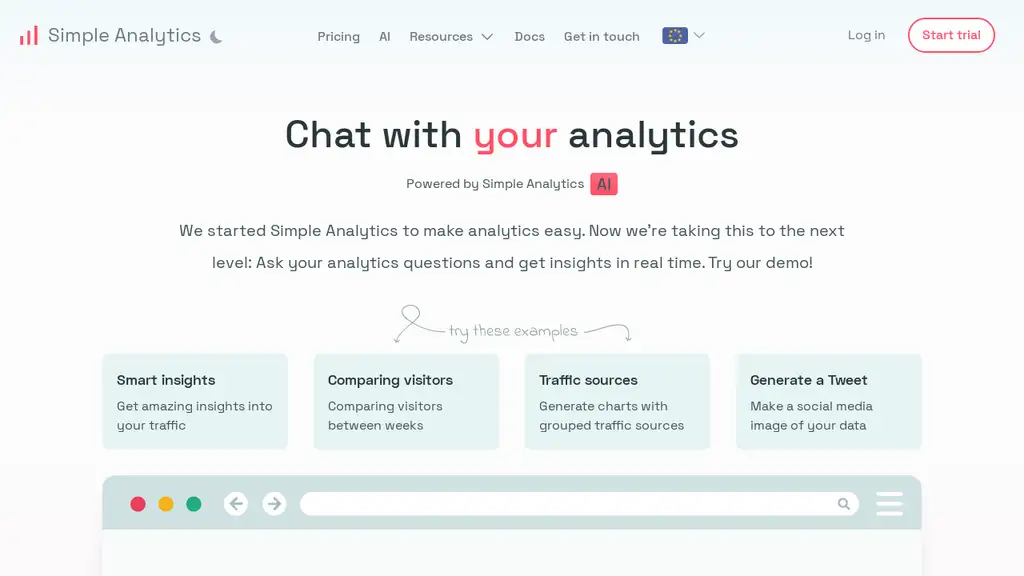
Simple Analytics AI is an innovative tool designed to revolutionize the way users interact with their analytics. By enabling users to chat directly with their analytics, it eliminates the need for manual searches and cumbersome dashboard tools. This user-friendly platform provides real-time insights...
Real-time insights generation
Data analysis via analytics questions
Charts and data visualizations
User-friendly interface
Demo for hands-on experience
AI analyticsprivacydeveloper toolssmart data analysis
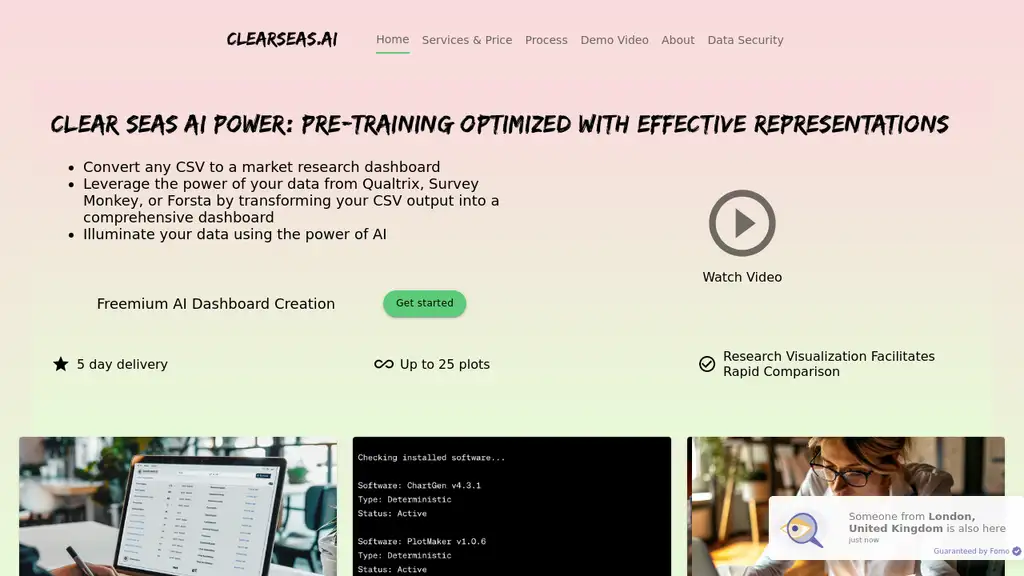
Transform survey data into intuitive dashboards with AI.
ClearSeas.ai POWER revolutionizes the way you interpret and visualize survey data. With ClearSeas.ai, you can transform any CSV file into an intuitive market research dashboard powered by advanced AI analytics. The market research dashboard offers a range of services and features, converting CSV dat...
CSV file import
Market research dashboard
AI analytics
25 plots for comparison
Data security
Expert survey design
market researchCSV data analysismarketing analyticsAI analyticsdata visualization
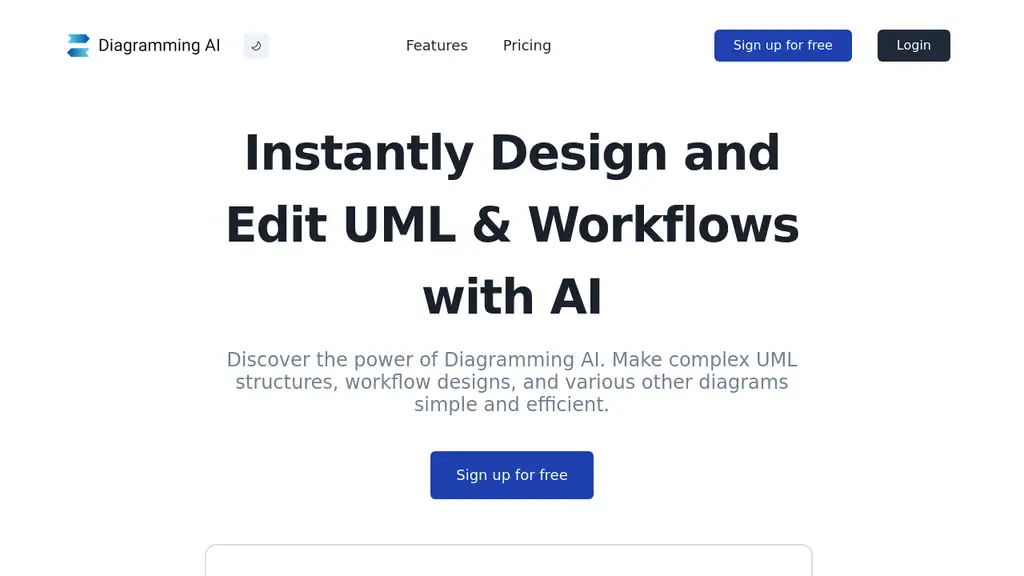
Diagramming AI is an innovative tool that leverages advanced AI technology to instantly design UML diagrams and workflows, making complex structures and designs simple and efficient. With AI-powered diagram creation, users can easily generate and edit diagrams using intuitive AI commands. The tool a...
AI-powered diagram creation
Engaging with AI chat for suggestions
Customizable color themes
Expansive library of diagram templates
Quick edit functionality
AI diagram creatorUML generatorworkflow diagramdesign toolvisualization